 THUNDER BAY – The wind industry would like you to believe that windmills are now cost competitive with natural gas units for electricity generation[i], but in 2010, natural gas fired units added twice the capacity that wind units added through most of the year.[ii] Why? There are several reasons. The recession lowered the demand for electricity, natural gas prices are low due to production and reserves of shale gas, and one of wind’s federal subsidies was expiring at the end of 2010. Some wind producers, seeing the 1603 investment tax credit for wind expiring in 2010, decided to hold off constructing new units until they could be guaranteed this federal subsidy. Legislation during the lame duck session of 2010 added
  another year to the 1603 investment tax credit, a direct Treasury grant that provides a 30-percent investment tax credit for wind units under construction in 2011 without needing a “tax equity” partner to offset income. So, moving into 2011, the wind industry has over 5,600 megawatts already under construction. In the entire year of 2010, it built just 5,115 megawatts, according to the American Wind Energy Association.[iii]
To add insult to injury, China built more wind units in 2010 than the United States did. China constructed about 16,000 megawatts of wind turbines, placing that country in first place globally in total wind capacity, followed closely by the United States, with just 1,620 megawatts (4 percent) separating the total wind capacity of the two countries.[iv]
The fact that China built more wind units in 2010 than the United States is used by some to say that the United States is falling behind China. However, wind proponents should realize that China is also outstripping us in the construction of new coal-fired, nuclear, and hydroelectric generating capacity. Why? Because China’s economic growth is so large, around 3 times the growth rate of the United States’ Gross Domestic Product, that it needs a lot of energy to fuel it.
Generating Costs and Subsidies
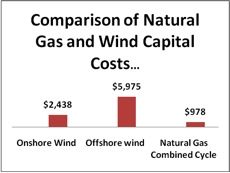
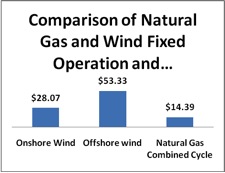
While the wind industry argues that wind is competitive with natural gas generation, government data shows otherwise. The Energy Information Administration’s most recent report on capital costs for generating technologies estimates the capital costs of an onshore wind plant at 2.5 times higher than that of a natural gas combined cycle plant and its fixed operation and maintenance costs at twice that of the natural gas plant. For an offshore wind plant, the costs are even higher, over 6 times higher for the capital costs and over 3.5 times higher for the fixed operation and maintenance costs compared to the natural gas facility.[v] These higher wind costs do not offset the cost of the fuel for the natural gas plant.
Another government study shows that wind subsidies are much higher than natural gas and oil subsidies for electricity generation. The Energy Information Administration’s study comparing subsidies for electricity generation by fuel type found that wind subsidies were over three times the size of natural gas and oil subsidies for electricity generation on a total outlay basis and they were 93 times higher than those for natural gas and oil generators on a unit of production basis. The data are for fiscal year 2007, the latest year the study was performed.[vi] See charts below.
U.S. and China Electricity Generation
Due to the recession, U.S. electricity generation is in a non-growth mode. In 2008, it was down by 1 percent from 2007 levels, and in 2009, it was down 4 percent from 2008 levels. While not all data is in for 2010, U.S. electricity generation seems to be on par with 2008 data for the first 3 quarters of 2010.[vii] Those numbers are certainly not anywhere near the growth that China is experiencing. China’s electricity generation grew by 6 percent in 2008 and by another 7 percent in 2009[viii], requiring a lot of new generating capacity to keep its economy in needed electricity.
Thus, China has been constructing all sorts of generating capacity: wind, solar, coal, nuclear, and hydroelectric. According to the Energy Information Administration, China’s electric generating capacity totaled 797 gigawatts at the end of 2008.[ix] According to China’s National Energy Administration, electric generating capacity in China ended 2010 at 950 gigawatts.[x] Thus, China added 153 gigawatts over a two-year span. To meet a GDP growth rate of 9.6 percent in 2011[xi], China is expected to add an additional 80 gigawatts of electrical capacity this year.[xii]
Coal is still the major generating technology for China. In 2009, China added 51 gigawatts of coal-fired capacity[xiii] and was expected to add about the same amount in 2010. According to calculations based on official data, China used coal to generate 86 percent of its electricity in the first quarter of 2010.[xiv] China’s thermal capacity, most of which is coal, is expected to increase by between 260 and 270 gigawatts over the next five years.[xv]
China is intent on making nuclear power a major contributor to their electricity generation mix. They currently have 13 nuclear plants in operation, and 25 more facilities are under construction, which equal almost half the total nuclear reactors under construction in the world. Their 2020 goal is to have 40 reactors on line, which they should easily met or exceed.[xvi]
Hydroelectric power in China is second to none, with engineering feats like the Three Gorges Dam supplying 18,200 megawatts of power, with a 4,200-megawatt increase in capacity planned for 2012.[xvii] Other hydroelectric projects are continuing. The Xiluodu project on the Jinsha River, a 12,600 megawatt plant, is scheduled for completion in 2015 as part of a 14-facility hydroelectric development plan. Currently under construction and scheduled for completion in 2014 is the world’s second largest dam at almost 985 feet on the Yalong River, part of the 3,600 megawatt Jinping I project. It is part of a plan by the Ertan Hydroelectric Development Company to construct 21 facilities with 34,600 megawatts of capacity on the river.[xviii]
At the end of 2008, China had 172,000 megawatts of hydroelectric power.[xix] In 2009, China generated 549 billion kilowatt hours of electricity from hydropower, 42 percent more than Brazil, and more than twice as much as the United States.[xx] The government’s target for hydroelectric capacity is 300,000-megawatts by 2020, which it is well on its way to achieving.[xxi]
In 2009, China had 25,800 megawatts of wind capacity, and according to the Chinese Renewable Energy Industries Association, it ended 2010, with 41,800 megawatts of wind capacity. Because China’s electricity grid was not designed for this level of wind capacity, it has a problem ensuring all that wind capacity is grid-connected. According to China’s Renewable Energy Council, the industry’s “biggest problem for the future” is getting the wind power to the east and southeast, where it is needed, from its generation sites in the north. In 2009, for example, only 73 percent had been grid-connected.[xxii] China is known for its manufacturing of equipment for solar and wind facilities and is now letting the world know it can also be a leader in facility construction of those technologies as well.
Conclusion
The wind industry would like not only more subsidies for wind, but policies such as a renewable electricity standard, requiring set percentages of qualified renewable generation in the future.[xxiii] They say this is the only way to continue our domination of the market. However, wind is more costly than natural gas generation, it is not reliable and not dispatchable, and it is subsidized by a huge factor already. What would be best for the American public is to let the market work subsidy free for all.
This article is special to NetNewsledger.com it is re-published with permission from The Institute for Energy Research in Washington DC. The information is provided as a means of facilitation of public discussion on the issue.
[i] American Wind Energy Association, U.S. wind energy industry finishes 2010 with half the installations of 2009, activity up in 2011, now cost-competitive with natural gas, January 24, 2010, http://www.awea.org/rn_release_01-24-11.cfm
[ii] Energy Information Administration, http://www.eia.doe.gov/cneaf/electricity/epm/tablees3.html
[iii] American Wind Energy Association, U.S. wind energy industry finishes 2010 with half the installations of 2009, activity up in 2011, now cost-competitive with natural gas, January 24, 2010, http://www.awea.org/rn_release_01-24-11.cfm
[iv] Ibid. and Global Energy Wind Council, China Wind Energy Outlook 2010, http://www.gwec.net/index.php?id=169&L=0&0=
[v] Energy Information Administration, Updated Capital Cost Estimates for Electricity Generation Plants, http://www.eia.gov/oiaf/beck_plantcosts/index.html
[vi] Energy Information Administration, Federal Financial Interventions and Subsidies in Energy Markets 2007, http://www.eia.doe.gov/oiaf/servicerpt/subsidy2/pdf/execsum.pdf
[vii] Energy Information Administration, Monthly Energy Review, http://www.eia.gov/mer/pdf/pages/sec7_5.pdf
[viii] Energy Information Administration, http://tonto.eia.doe.gov/cfapps/ipdbproject/IEDIndex3.cfm?tid=2&pid=2&aid=12
[ix] Energy information Administration, http://tonto.eia.doe.gov/cfapps/ipdbproject/IEDIndex3.cfm?tid=2&pid=2&aid=7
[x] Reuters, China power sector to boom as oil sector goes slower, January 6, 2011, http://www.reuters.com/article/idUSTRE7052JT20110106
[xi] Reuters, China power sector to boom as oil sector goes slower, January 6, 2011, http://www.reuters.com/article/idUSTRE7052JT20110106
[xii] The New York Times, Peabody-Calera Partnership Could Bring U.S. ‘Green Cement’ to China, January 21, 2011, http://www.nytimes.com/cwire/2011/01/21/21climatewire-peabody-calera-partnership-could-bring-us-gr-92498.html?ref=energy-environment
[xiii] Bloomberg, Coal Imports May Rise 78% to China, India, Drive Up Prices: Energy Markets, December 14, 2010, http://www.bloomberg.com/news/2010-12-14/coal-imports-may-rise-78-to-china-india-drive-up-prices-energy-markets.html
[xiv] Radio Free Asia, China Mulls Coal Limit, September 7, 2010, http://www.rfa.org/english/energy_watch/coal-09072010113430.html
[xv] Reuters, China power sector to boom as oil sector goes slower, January 6, 2011, http://www.reuters.com/article/idUSTRE7052JT20110106
[xvi] Bloomberg, Nuclear Boom in China Sees Reactor Builders Risk Their Know-How for Cash, December 2, 2010, http://www.bloomberg.com/news/2010-12-02/china-nuclear-boom-sees-reactor-builders-risk-know-how-for-cash.html
[xvii] Energy Information Administration, International Energy Outlook 2010, http://www.eia.doe.gov/oiaf/ieo/electricity.html
[xviii] Ibid.
[xix] Energy Information Administration, http://tonto.eia.doe.gov/cfapps/ipdbproject/iedindex3.cfm?tid=2&pid=33&aid=7&cid=regions&syid=2004&eyid=2008&unit=MK
[xx] Energy Information Administration, http://tonto.eia.doe.gov/cfapps/ipdbproject/iedindex3.cfm?tid=6&pid=33&aid=12&cid=regions&syid=2005&eyid=2009&unit=BKWH
[xxi] Energy Information Administration, International Energy Outlook 2010, http://www.eia.doe.gov/oiaf/ieo/electricity.html
[xxii] The Wall Street Journal, Who Will Sail Ahead in Wind Power Race?, January 25, 2011,
http://blogs.wsj.com/chinarealtime/2011/01/25/us-china-who-will-sail-ahead-in-wind-power-r ace/?KEYWORDS=%22climate%22
[xxiii] Institute for Energy Research, http://www.instituteforenergyresearch.org/rem


